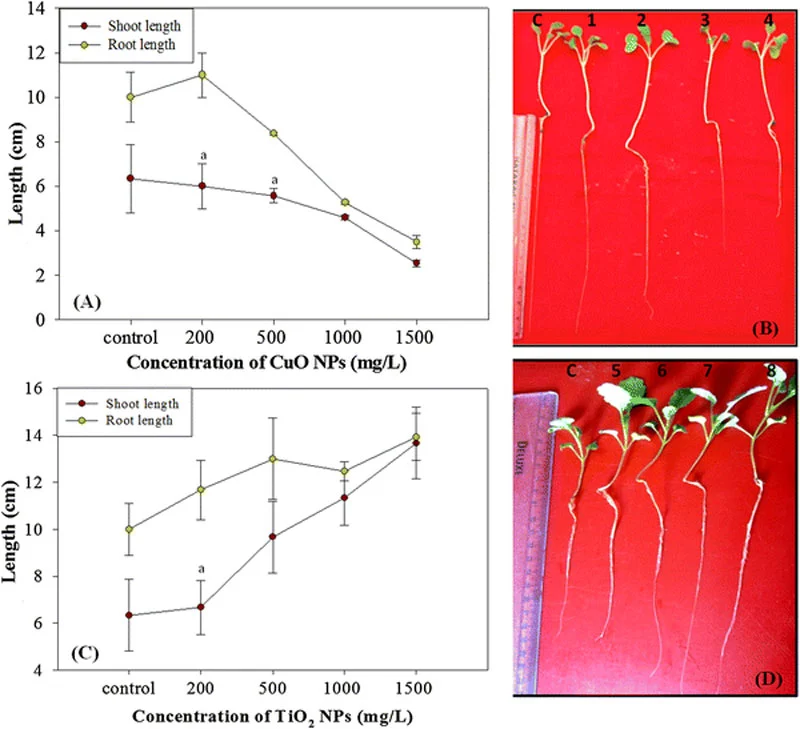
Fig. 2 (A) Graphical representation of effect of CuO NPs on shoot and root length of B. juncea. (B) Effect of CuO NPs (C, 1, 2, 3, 4) symbolize the plants at different concentrations, i.e., control, 200 500, 1000, 1500 mg/L resp. (C) Effect of TiO2 NPs on shoot and root length of B. juncea. (D) Effect of TiO2 NPs (C, 5, 6, 7, 8) correspond to the plants at different concentrations, i.e., control, 200 500, 1000, 1500 mg/L resp.
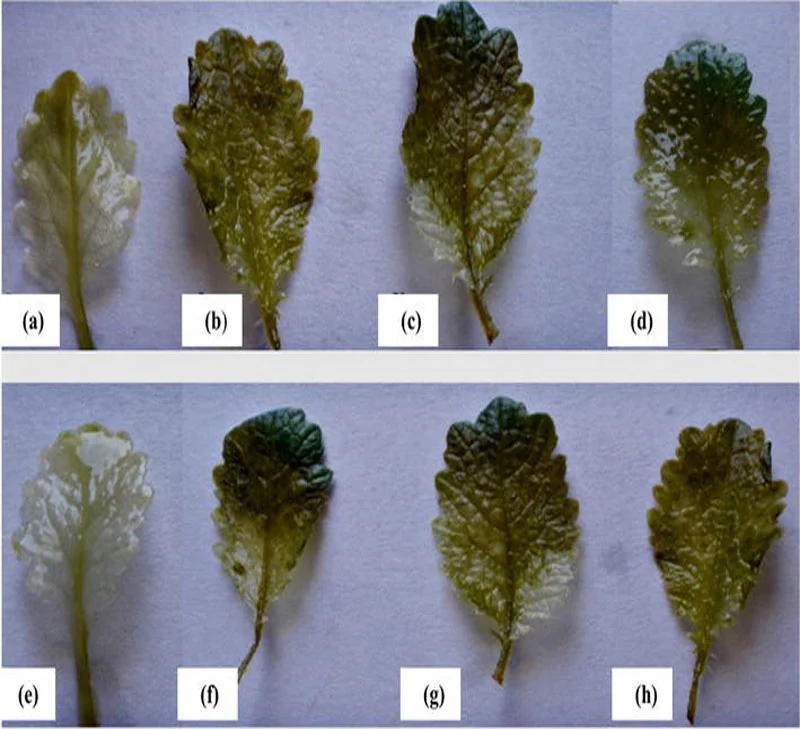
Fig. 4 Effect of NPs on accumulation of H2O2 in leaves tested by means of the ROS sensitive dye DAB in B. juncea seedlings. a, e Control leaves showing no polymerized product as almost transparent visibility. b–dCuO treated plant leaves (200, 1000, 1500 mg/L) with greenish brown spots as compared to control plant leaves and f–h TiO2 treated plant leaves showing spots (200, 1000, 1500 mg/L), respectively